Remote sensing offers a cost-effective method to capture field data for analysis and planning purposes. Layer Informatics offers a number of remote sensing and analysis services including:
Layer Informatics’s image interpreters are deployed across various projects, and can rapidly scale to individual project requirements. We can also deploy teams on-site for critical tasks and for technically challenging data analysis projects.
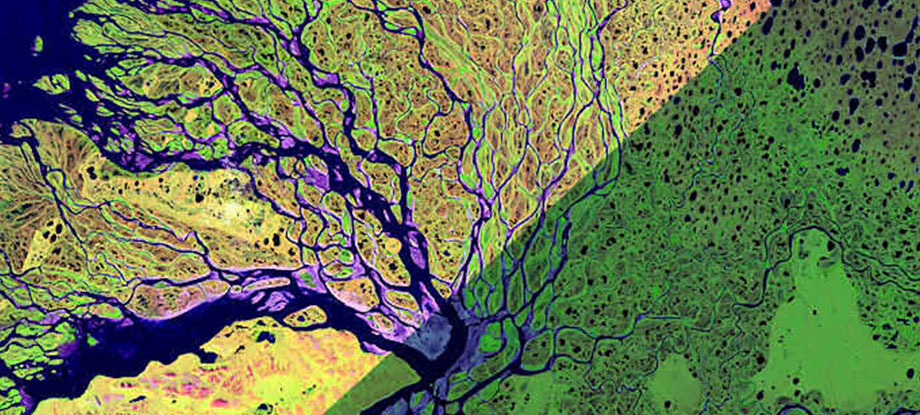
The interpretation of satellite imagery and aerial photographs involves the study of various basic characters of an object with reference to spectral bands which is useful in visual analysis. The basic elements are shape, size, pattern, tone, texture, shadows, location, association and resolution.
As part of the image processing workflow, the landscape is categorized against a classification schema. The schema is determined by the characteristics of the landscape and environment, as well as the intended end uses of the data and required thematic detail. Layer Informatics has delivered mapping with over 50 different categories, each of which is carefully defined to ensure meaningful outputs.
Depending on client needs, a mixture of natural, semi-natural, as well as human land use categories, can be deployed.


Supervised classification is based on the idea that a user can select sample pixels in an image that are representative of specific classes and then direct the image processing software to use these training sites as references for the classification of all other pixels in the image. Training sites (also known as testing sets or input classes) are selected based on the knowledge of the user. The user also sets the bounds for how similar other pixels must be to group them together. These bounds are often set based on the spectral characteristics of the training area, plus or minus a certain increment (often based on "brightness" or strength of reflection in specific spectral bands). The user also designates the number of classes that the image is classified into. Many analysts use a combination of supervised and unsupervised classification processes to develop final output analysis and classified maps.
Unsupervised classification is where the outcomes (groupings of pixels with common characteristics) are based on the software analysis of an image without the user providing sample classes. The computer uses techniques to determine which pixels are related and groups them into classes. The user can specify which algorithm the software will use and the desired number of output classes but otherwise does not aid in the classification process. However, the user must have knowledge of the area being classified when the groupings of pixels with common characteristics produced by the computer have to be related to actual features on the ground (such as wetlands, developed areas, coniferous forests, etc.).
In the context of remote sensing, change detection refers to the process of identifying differences in the state of land features by observing them at different times. This process can be accomplished either manually or with the aid of remote sensing software. Manual interpretation of change from satellite images or aerial photos involves an observer or analyst defining areas of interest and comparing them between images from two dates. Manual image interpretation works well when assessing change between discrete classes (e.g., forest openings, land use, and land cover maps) or when changes are large (e.g., heavy mechanized maneuver damage, engineering training impacts). Manual image interpretation is also an option when trying to determine change using images or photos from different sources (e.g., comparing historic aerial photographs to current satellite imagery).
The slope aspect analysis is simple to understand. Aspect values indicate the directions the physical slopes face. We can classify aspect directions based on slope angle with a descriptive direction. An output aspect raster will typically result in several slope direction classes. When the terrain is flat, there is no slope. So this also means that there is no aspect.
But in the mountains, there are slopes in all directions. There are north-facing, west-facing, south-facing and east-facing slopes. The compass direction that the slope faces is the slope aspect.
Land management and land planning require a knowledge of the current state of the landscape. Understanding current land cover and how it is being used, along with an accurate means of monitoring change over time, is vital to any person responsible for land management. Measuring current conditions and how they are changing can be easily achieved through land cover mapping, a process that quantifies current land resources into a series of thematic categories, such as forest, water, and paved surfaces. By using remotely sensed imagery and semi-automated classification methods, Layer Informatics provides cost-effective and accurate means to derive land resource information and maintain its currency into the future.